Investor Relations
Financial Highlights
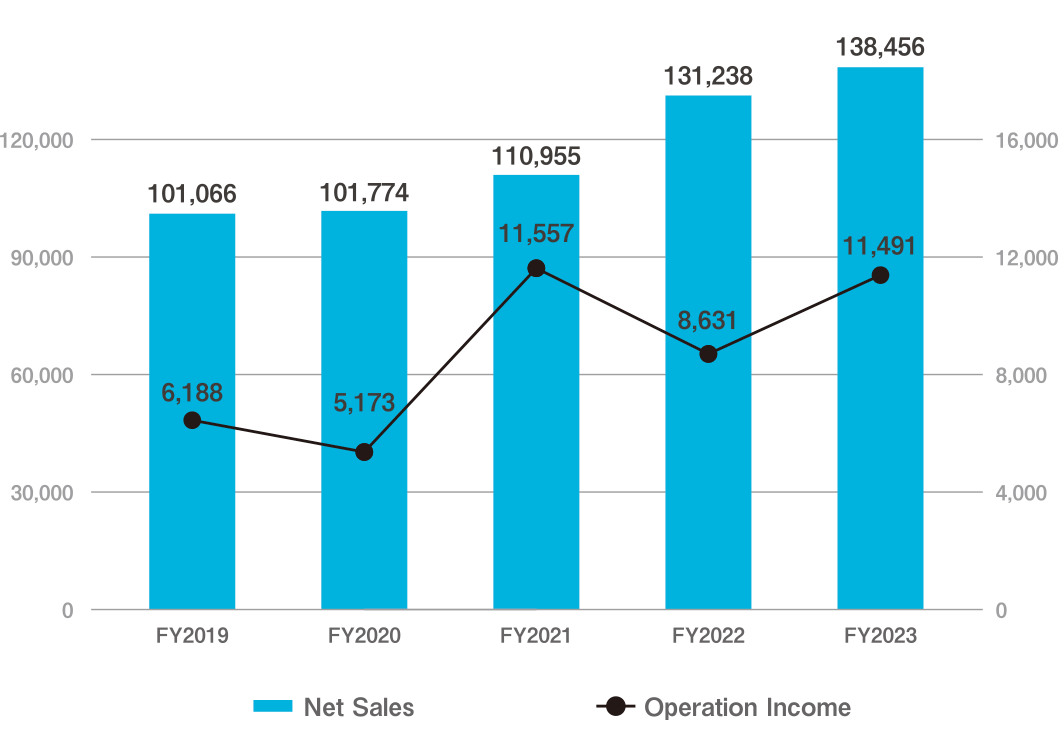
Net Sales and Operating Income
(million yen)

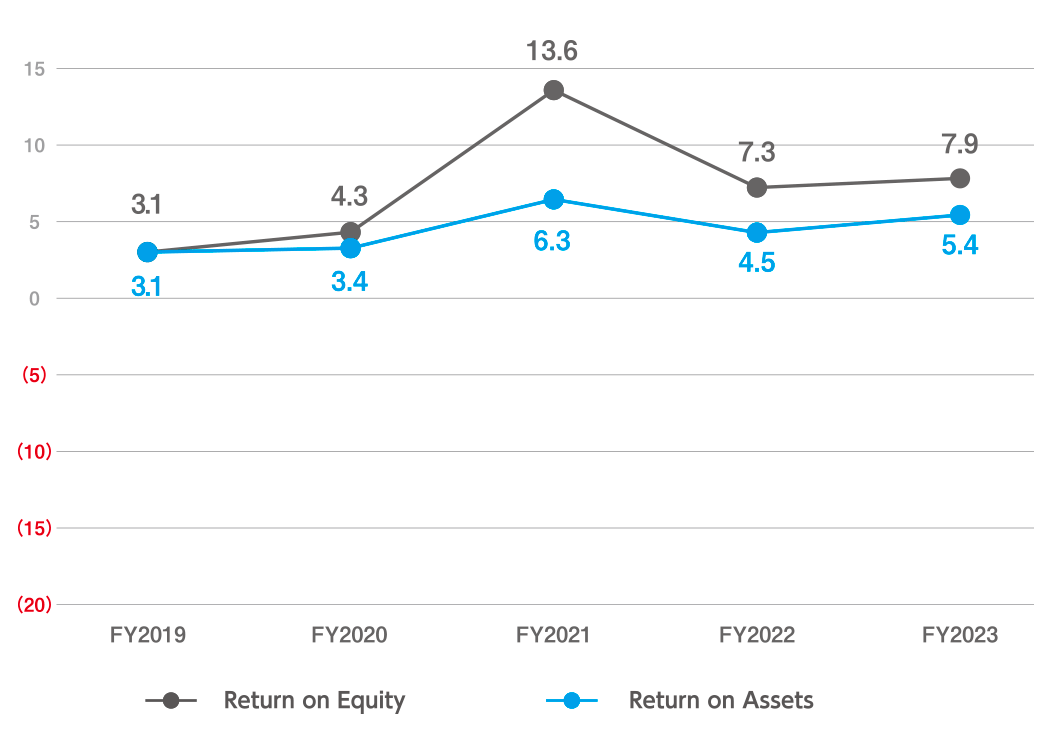
Return on Equity and Return on Assets
(%)

Busuness Performance Trends(consolidated)
*You can see the entire image in the figure by scrolling horizontally.
| Index | Unit | FY2020 | FY2021 | FY2022 | FY2023 | FY2024 |
|---|---|---|---|---|---|---|
| Net Sales | (million yen) | 101,774 | 110,955 | 131,238 | 138,456 | 145,196 |
| Operating Income | (million yen) | 5,173 | 11,557 | 8,631 | 11,491 | 10,482 |
| Ordinary Income | (million yen) | 5,944 | 13,272 | 10,349 | 14,850 | 11,392 |
| Net Income / loss | (million yen) | 3,373 | 11,690 | 6,947 | 7,988 | 8,410 |
| Assets | (million yen) | 180,021 | 185,758 | 201,913 | 224,324 | 225,097 |
| Net Assets | (million yen) | 79,515 | 91,869 | 97,431 | 106,116 | 114,448 |
| Net Income (Loss) Per Share | (Yen) | 84.41 | 292.58 | 175.75 | 209.27 | 219.98 |
| Capital Adequacy Ratio | (%) | 44.2 | 49.5 | 48.3 | 47.3 | 50.8 |
| Return on Equity | (%) | 4.3 | 13.6 | 7.3 | 7.9 | 7.6 |
| Return on Assets | (%) | 3.4 | 6.3 | 4.5 | 5.4 | 4.7 |
| Capital Expenditures | (million yen) | 6,365 | 5,153 | 5,907 | 9,648 | 10,519 |
| R&D Expenses | (million yen) | 8,639 | 8,165 | 9,156 | 9,758 | 10,736 |
| Interest-bearing Debt | (million yen) | 60,103 | 50,420 | 56,081 | 70,323 | 72,217 |
